Plotting Data
December 18, 2020—And doing it quickly (programming)
There are a couple of things that can make a line graph on the computer run really slow. It can take a while to get all the data points, and it can take a while to draw them all.
I’m going to talk about how to draw them as quickly as possible.
The scenario
Let’s say you have have ten million data points tracing out the below curve and you want to render the window in red.
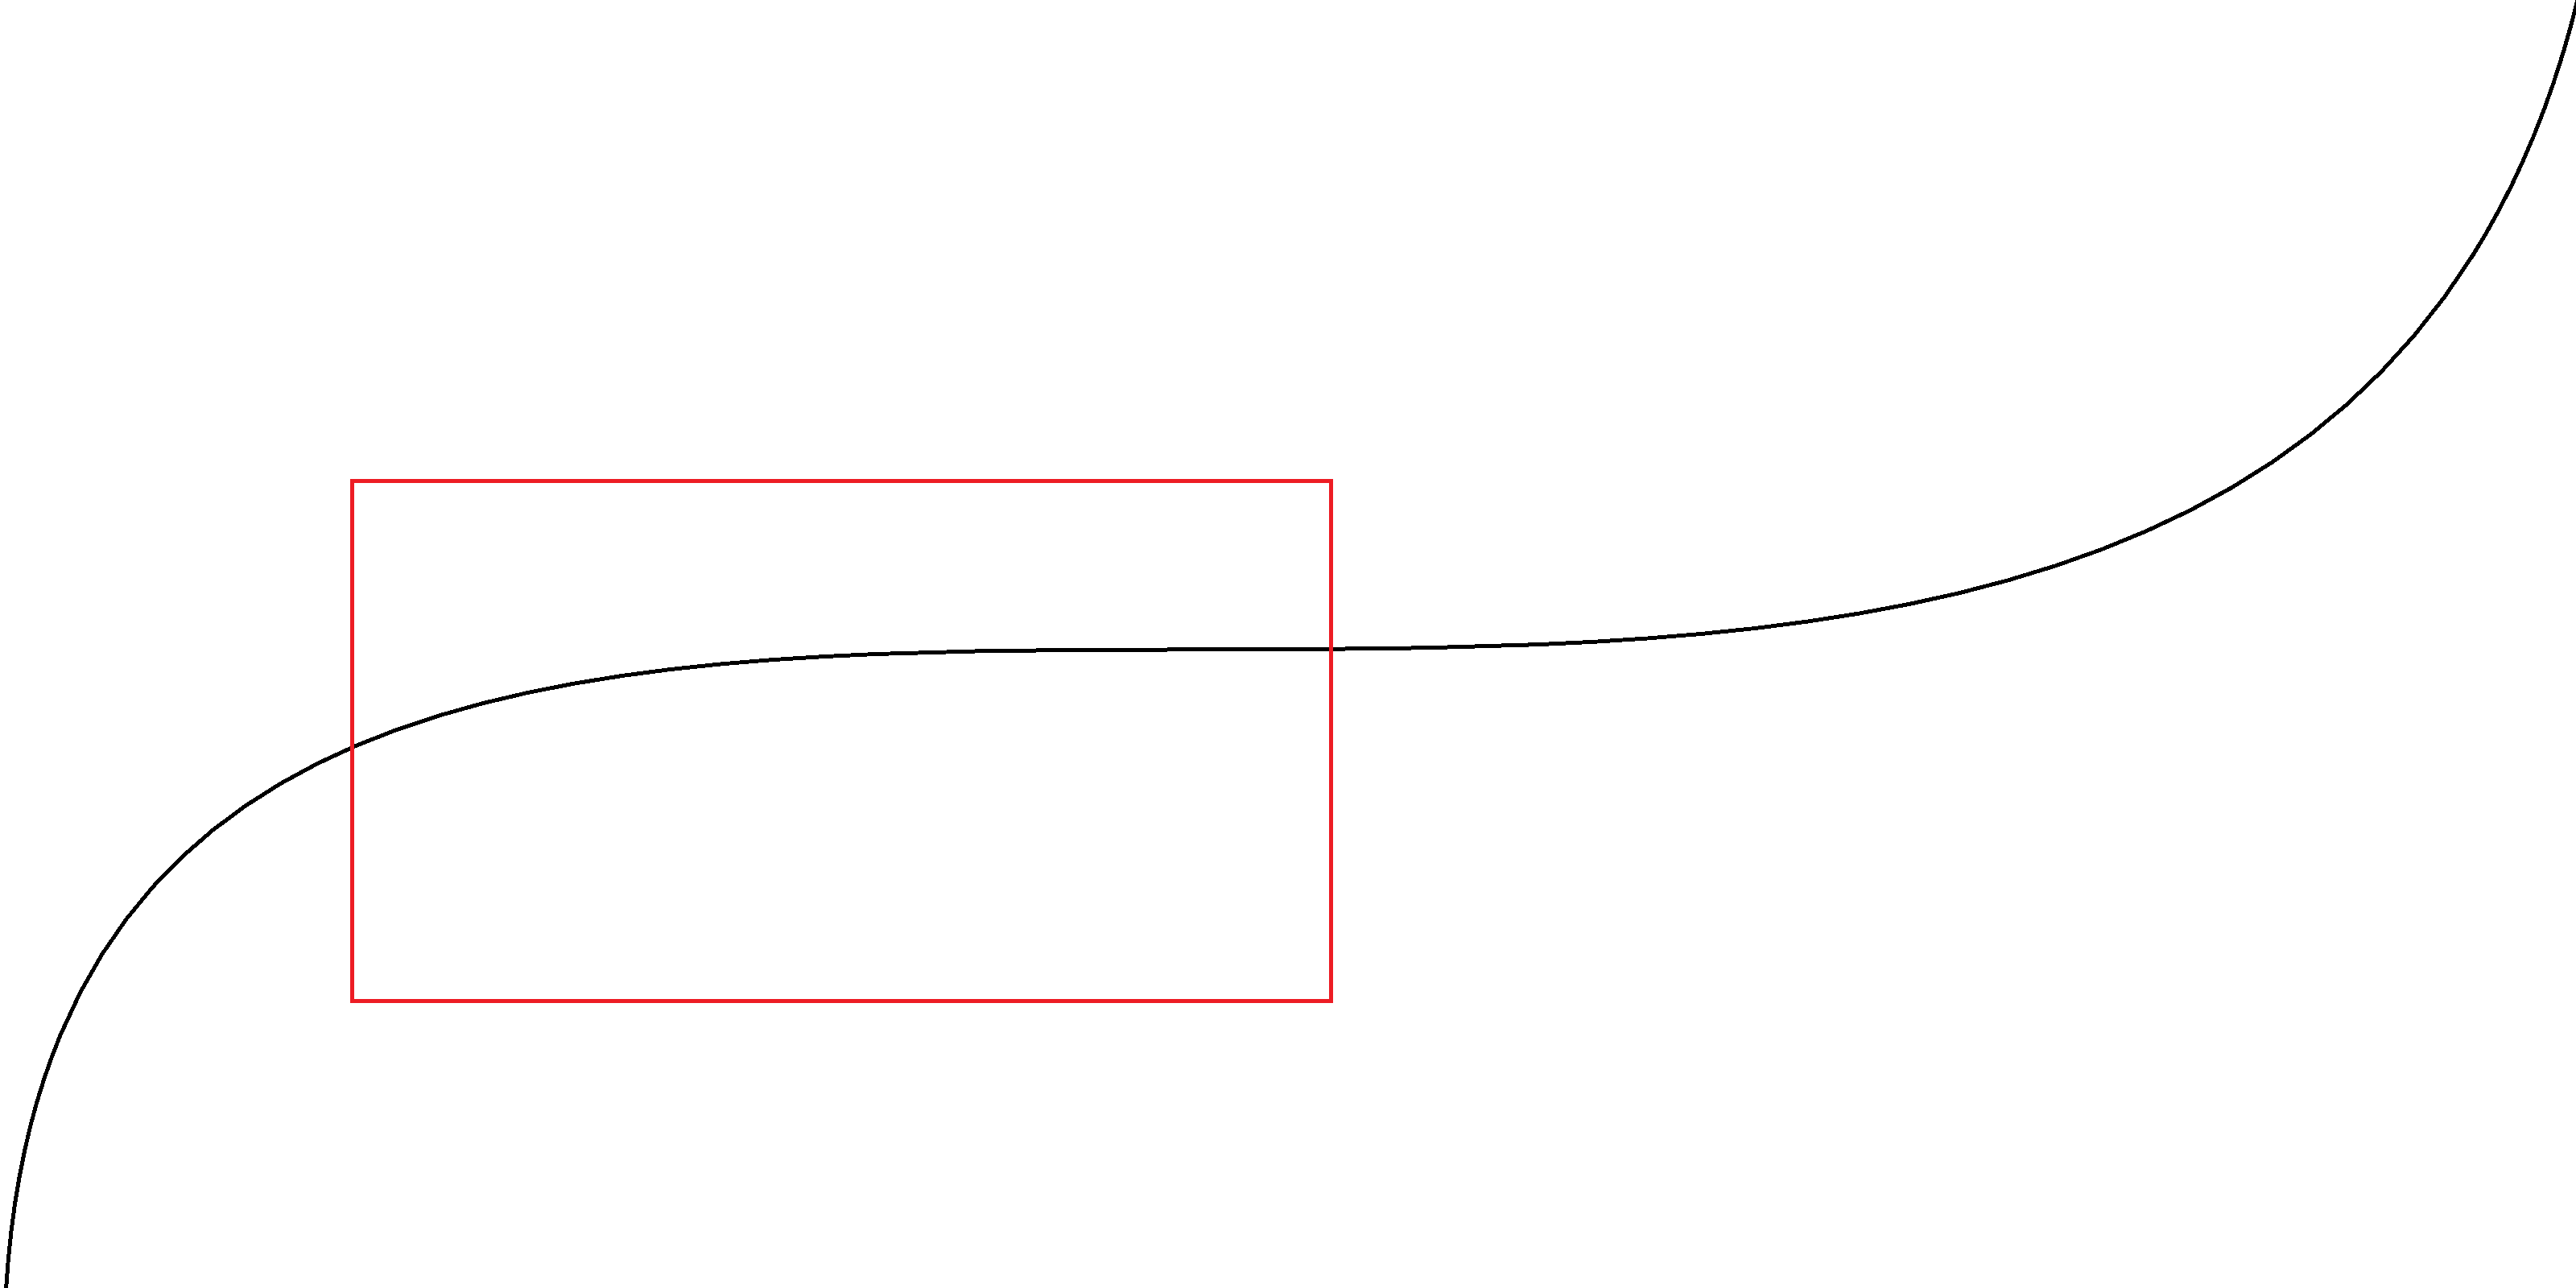
Millions of data points take a long time to draw. And it’s such a simple shape. Surely it can be done more quickly?
Details and a caveat
Now is a good time to mention a caveat. But I need to explain something first.
Keep in mind there are two coordinate systems. One of them is in the data, and the other is on the screen. The data coordinate system is application specific. The screen coordinate system is the location of pixels on the physical screen.
The place where the rendered plot will land on the screen is called the viewport. It’s a rectangle in the screen coordinate system.
The place in the data that shows up in the viewport we’ll call the data window. It’s also a rectangle but in the data coordinate system.
So the red box above is the data window.
The caveat is: for the rest of this article I’m going to pretend like the data and screen coordinate systems are the same. It’s easier for me but the point should be the same.
Parallelism
A quick note about parallelism: if you have the opportunity to render in parallel then that’s great. But I’m going to ignore parallelism because the lessons in this article will also apply to it.
Drawing API
We’re going to need a drawing API. Here it is:
public interface IDrawing
{
  void MoveTo(Point point);
  void LineTo(Point point);
}
You call MoveTo to start the drawing at some point (which is given in screen
coordinates). Then you call LineTo to draw from the previous location to a
given point (again given in screen coordinates).
So to draw a 200x100 pixel rectangle you could do this:
void DrawRectangle(IDrawing drawing)
{
  drawing.MoveTo(new Point(0, 0));
  drawing.LineTo(new Point(200, 0));
  drawing.LineTo(new Point(200, 100));
  drawing.LineTo(new Point(0, 100));
  drawing.LineTo(new Point(0, 0));
}
Naive approach
This will draw all the data points:
void DrawData(IDrawing drawing, IEnumerable<Point> data)
{
  var isFirstPoint = true;
  foreach (var point in data)
  {
    if (isFirstPoint)
    {
      isFirstPoint = false;
      drawing.MoveTo(point);
    }
    else
    {
      drawing.LineTo(point);
    }
  }
}
It works. There’s nothing incorrect about this. So it’s better than something that doesn’t work.
But this will be really slow when you have tons of data because it takes a lot longer to draw the pixels on the screen than it does to loop through the data.
Can we do better?
Reduce horizontal density of data points
The first thing that people usually think of is to skip over data points that don’t advance very far in a horizontal direction. They usually pick the positive horizontal direction because their data increases in that direction. But I’ll show code that handles both horizontal directions.
This code does that:
void DrawData(IDrawing drawing, IEnumerable<Point> data)
{
  var isFirstPoint = true;
  const double minDiscernableDifference = 1.0;
  Point lastPoint = default;
  foreach (var point in data)
  {
    if (isFirstPoint)
    {
      isFirstPoint = false;
      drawing.MoveTo(point);
      lastPoint = point;
    }
    else if (Math.Abs(point.X - lastPoint.X) >= minDiscernableDifference)
    {
      drawing.LineTo(point);
      lastPoint = point;
    }
  }
}
Problems
Unlimited potential for data loss. Here are some data points and whether they’ll be chosen or ignored by this algorithm:
| X | Y | Displayed |
|---|---|---|
| 0 | 0 | ✓ |
| 0.9 | 10000 | ✗ |
| 1 | 0 | ✓ |
| 1.9 | 10000 | ✗ |
| 2 | 0 | ✓ |
| 2.9 | 10000 | ✗ |
| 3 | 0 | ✓ |
| 3.9 | 10000 | ✗ |
| 4 | 0 | ✓ |
| 4.9 | 10000 | ✗ |
| 5 | 0 | ✓ |
In other words what will be rendered is a straight line. There’s no limit to how large (in the Y direction) the ignored coordinates can be.
Shimmer. And guess what happens when you zoom in a little bit:
| X | Y | Displayed |
|---|---|---|
| 0 | 0 | ✓ |
| 1.0 | 10000 | ✓ |
| 1.1 | 0 | ✗ |
| 2.1 | 10000 | ✓ |
| 2.2 | 0 | ✗ |
| 3.2 | 10000 | ✓ |
| 3.3 | 0 | ✗ |
| 4.3 | 10000 | ✓ |
| 4.4 | 0 | ✗ |
| 5.4 | 10000 | ✓ |
| 5.5 | 0 | ✗ |
Now you get a really jagged line.
And depending on the situation it can flash really quickly back and forth between the two. It isn’t very pretty.
Reduce horizontal and vertical density of data points
Both of those problems can be alleviated by comparing both X and Y coordinates, which is what most people try next.
Something like this:
void DrawData(IDrawing drawing, IEnumerable<Point> data)
{
  var isFirstPoint = true;
  const double minDiscernableDifference = 1.0;
  Point lastPoint = default;
  foreach (var point in data)
  {
    if (isFirstPoint)
    {
      isFirstPoint = false;
      drawing.MoveTo(point);
      lastPoint = point;
    }
    else if ((point - lastPoint).Length >= minDiscernableDifference)
    {
      drawing.LineTo(point);
      lastPoint = point;
    }
  }
}
Now anytime a point is sufficiently distant from the previous point in any direction it’ll show up on the screen. No more shimmer and no more data loss.
But it’s still not perfect.
Problems
These are actually problems with the previous approaches too, but…
Straight lines have too many points. Here’s how some data points in a straight line will be handled:
| X | Y | Displayed |
|---|---|---|
| 0 | 0 | ✓ |
| 1 | 0 | ✓ |
| 2 | 0 | ✓ |
| 3 | 0 | ✓ |
| 4 | 0 | ✓ |
| 5 | 0 | ✓ |
That’s a lot more lines on the screen than this visually indistinguishable equivalent:
| X | Y | Displayed |
|---|---|---|
| 0 | 0 | ✓ |
| 1 | 0 | ✗ |
| 2 | 0 | ✗ |
| 3 | 0 | ✗ |
| 4 | 0 | ✗ |
| 5 | 0 | ✓ |
Congested zig zags stay congested. Here’s how some other data points in a bunch of tight zig zags will be handled:
| X | Y | Displayed |
|---|---|---|
| 0 | 0 | ✓ |
| 0 | 1000 | ✓ |
| 0 | 0 | ✓ |
| 0 | 1000 | ✓ |
| 0 | 0 | ✓ |
| 0 | 1000 | ✓ |
That’s a lot more lines on the screen than this visually indistinguishable equivalent:
| X | Y | Displayed |
|---|---|---|
| 0 | 0 | ✓ |
| 0 | 1000 | ✗ |
| 0 | 0 | ✗ |
| 0 | 1000 | ✗ |
| 0 | 0 | ✗ |
| 0 | 1000 | ✓ |
Rectangles and bounding boxes
I used the phrase “visually indistinguishable equivalent”. What does it mean? It means we want to find the most simplified version of the data points that will look just the same. It turns out this is a good goal.
By looking at the problem from this perspective you can see why all the previous strategies weren’t the best. Neither the naive approach nor the horizontal+vertical density reduction approach were the most simplified. And the horizontal density reduction approach isn’t visually identical.
One thing that helps to get a much more simplified version (while still being visually identical) is to think in terms of rectangles and bounding boxes.
Each line segment is just like a skinny rectangle on the screen (lines at an angle are the same as skinny rectangles tilted at an angle). And a bounding box is just a rectangle that’s wide and long enough to contain some line segments (it can also be tilted at an angle).
So a single line segment will be visually indistinguishable from a group of line segments if the bounding box around the group of line segments is similar enough to the single line segment’s rectangle.
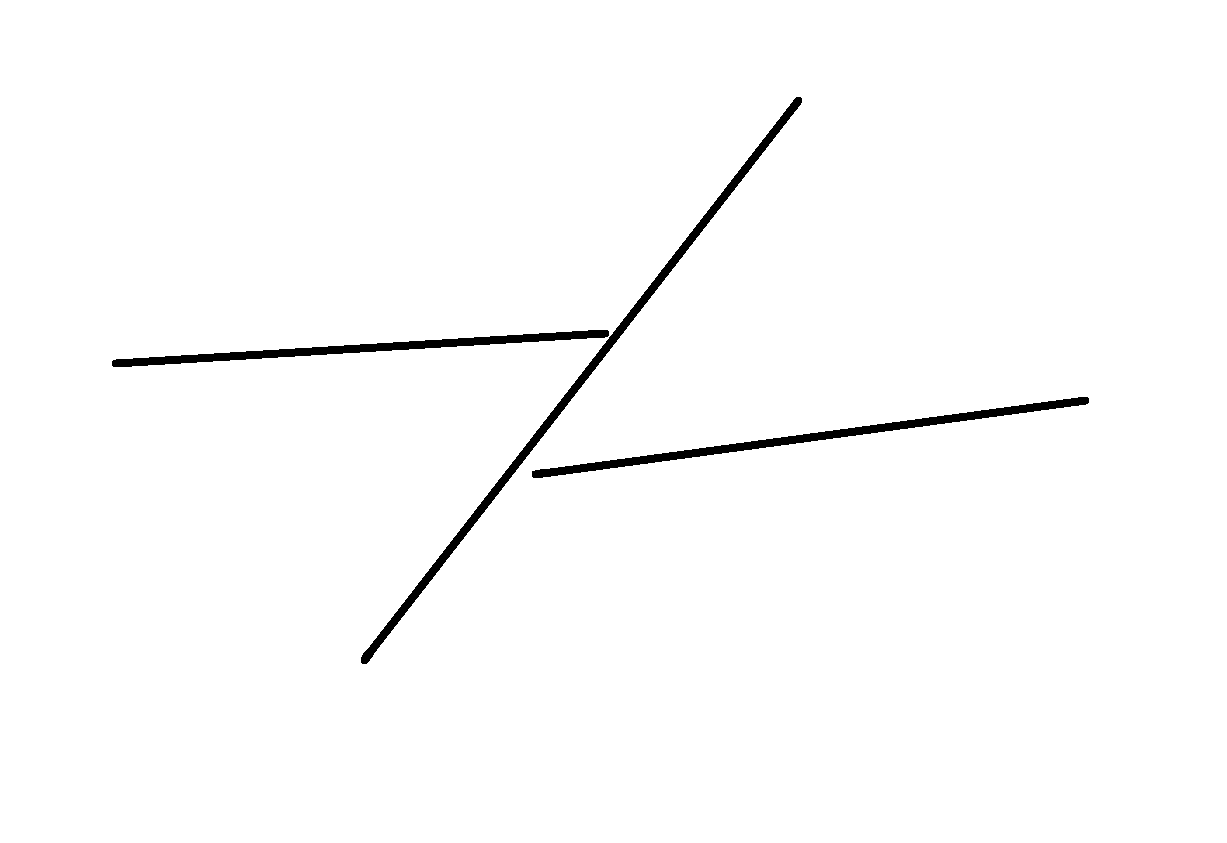
In other words, from far enough away this group of line segments:
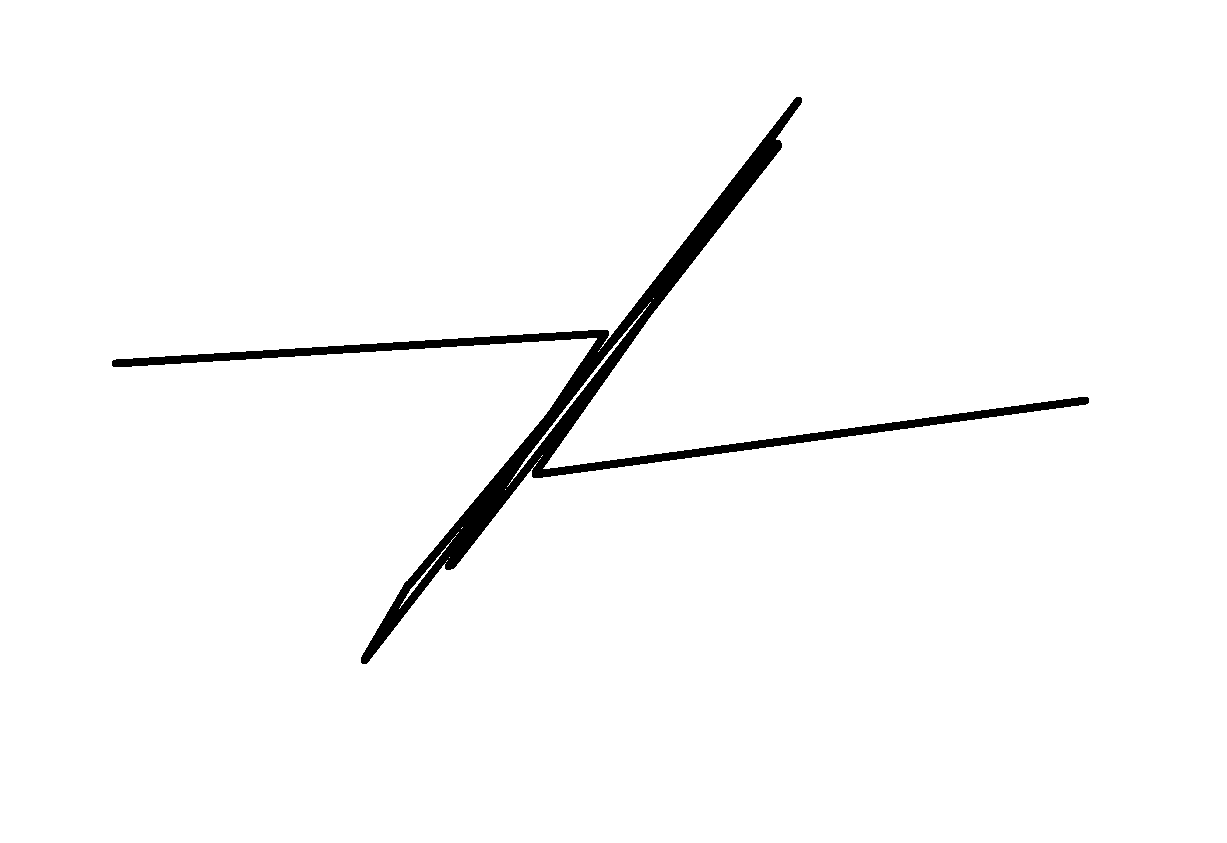
…can be reduced to this:
The individual line segments won’t even have to connect because when you’re zoomed out enough their pixels will be so relatively large that they’ll be touching. When you zoom out far enough, render the data points, and look closely at the pixels on the screen, then both of the above will look something like this:

The algorithm
First we’ll need to encapsulate the idea of a bounding box around a set of points:
class BoundingBox
{
  /// <summary>
  /// The first point that was added to the bounding box
  /// </summary>
  public Point EntryPoint { get; }

  /// <summary>
  /// A line segment that is visually equivalent to the bounding box.
  /// </summary>
  public (Point, Point) MajorLineSegment { get; }

  /// <summary>
  /// The length of the bounding box.
  /// </summary>
  public double MajorLineSegmentDistance { get; }

  /// <summary>
  /// The width of the bounding box.
  /// </summary>
  public double MinorDistance { get; }

  public void Add(Point point);

  public void Reset();
}
With some implementation of that, here’s some inspirational code that should get you started in the right direction:
void DrawData(IDrawing drawing, IEnumerable<Point> data)
{
  var isFirstPoint = true;
  const double minDiscernableDifference = 1.0;
  var boundingBox = new BoundingBox();
  var lastPoint = default(Point);
  foreach (var point in data)
  {
    if (isFirstPoint)
    {
      isFirstPoint = false;
      drawing.MoveTo(point);
    }

    boundingBox.Add(point);
    if (boundingBox.MinorDistance < minDiscernableDifference)
    {
      lastPoint = point;
      continue;
    }

    // Draw the simplified version of the bounding box
    drawing.LineTo(boundingBox.EntryPoint);
    var (begin, end) = boundingBox.MajorLineSegment;
    drawing.MoveTo(begin);
    drawing.LineTo(end);
    drawing.MoveTo(lastPoint);

    // Reset and re-add the current point so it's ready for the next iteration
    boundingBox.Reset();
    boundingBox.Add(point);

    lastPoint = point;
  }

  // Draw the simplified version of the bounding box so that the last data
  // points aren't lost
  {
    drawing.LineTo(boundingBox.EntryPoint);
    var (begin, end) = boundingBox.MajorLineSegment;
    drawing.MoveTo(begin);
    drawing.LineTo(end);
    drawing.MoveTo(lastPoint);
  }
}
Caution
- I’m leaving it as an exercise for you to fix this code to take care of drawing the bounding box correctly (if at all) when too few points have been added to it
- You’ll also want to think about the case when some of the bounding box’s points aren’t far enough apart to warrant drawing them
- You’ll have to implement the
BoundingBoxclass - This was only loosely inspired by working code I wrote so it probably has other bugs. Sorry I can’t just post up the code I wrote—it belongs to my employer
Hints:
- Why are we drawing any line segments that lie entirely outside the viewport? You don’t want to just check if individual points are in the viewport, because a line can have both endpoints outside the viewport yet it still needs to be drawn because it crosses through the viewport. You want line clipping
- My implementation of
BoundingBox.Add(not shown here) has time complexity \(O(n^2)\). In that case and with the above code it would actually be faster to just draw all the points than figure out the optimal bounding box around a sufficiently long and straight string of data points. Hint: you don’t have to simplify all the data points in only a single fine-grained pass… divide and conquer - I don’t know how to implement a perfectly minimal bounding box algorithm. I ran out of time thinking about it and only came up with a merely good enough one. (Sure, bounding boxes that only sit straight on one of their sides are really fast and easy—just min/max the points to get each of the four corners—But the only kind of bounding box that’s useful here is one that can be rotated in any orientation.) But an elegant way to form a good enough bounding box for a set of points is to treat the two points farthest from one another in that set as the major axis (giving the direction and length of the bounding box), and the maximum distance of the points from that line as the minor axis distance (giving the width of the bounding box). It’s not perfect, but it works pretty well. If I needed a better implementation then I would think harder about forming a convex polygon around the set of data points (I think there are fast algorithms for that) and then figure out how to fit a rectangle of minimal area around that polygon (which I suspect could be done quickly somehow)
Also I’ll just briefly point out that if you are trying to establish and maintain the correctness of this kind of stuff only by running a UI and seeing how it looks on the screen in various scenarios, then you’re doing it wrong. This is one of those cases where everything can be broken down into small “units” of responsibility and then unit tested with automated tests, with only the occasional sanity check by firing up a UI. Enough has been written about unit testing elsewhere so that’s all I’ll say here.
Downsides
This is definitely more complicated than the other algorithms. I think this is somewhere in the territory of optimizations. Make sure you have something that at least works before spending a ton of time on this.
It doesn’t help if your data is going randomly in all directions. Let’s hope you’re not trying to plot data like that.
Upsides
This approach can perform much better than the other algorithms.
As long as a single axis exists in which your data is non-decreasing then it’ll work. No matter the direction of that axis. It’ll also work just as well in a few other limited cases.
The point
Thinking in terms of bounding boxes should get you most of the way there.